GRAPHIC CONTENT: Online Shopping in the U.S.
The face of retail commerce is changing quickly as new technology and payments solutions are introduced into the marketplace. Perhaps the most significant shift in the landscape of retail has been the explosion of online shopping. From its roots during the dot com boom of the 1990s to the now intense competition between massive online retailers and traditional retailers looking to expand online, online commerce has rocketed into ubiquity and shook the foundations of brick-and-mortar retail. Look no further than the market’s reaction to Amazon’s acquisition of natural foods grocery chain Whole Foods in mid-July 2017 for proof.
While the impact for consumers has been obvious, online shopping has shaped the payments experience for merchants of all sizes. Through payment facilitators, ISVs and new POS technologies, the sales channel has been dynamic in addressing the needs of merchants as commerce goes digital. In this ETA Graphic Content, we examine exactly how consumers are utilizing online retail, the current state of the online buying experience and where growth is likely.
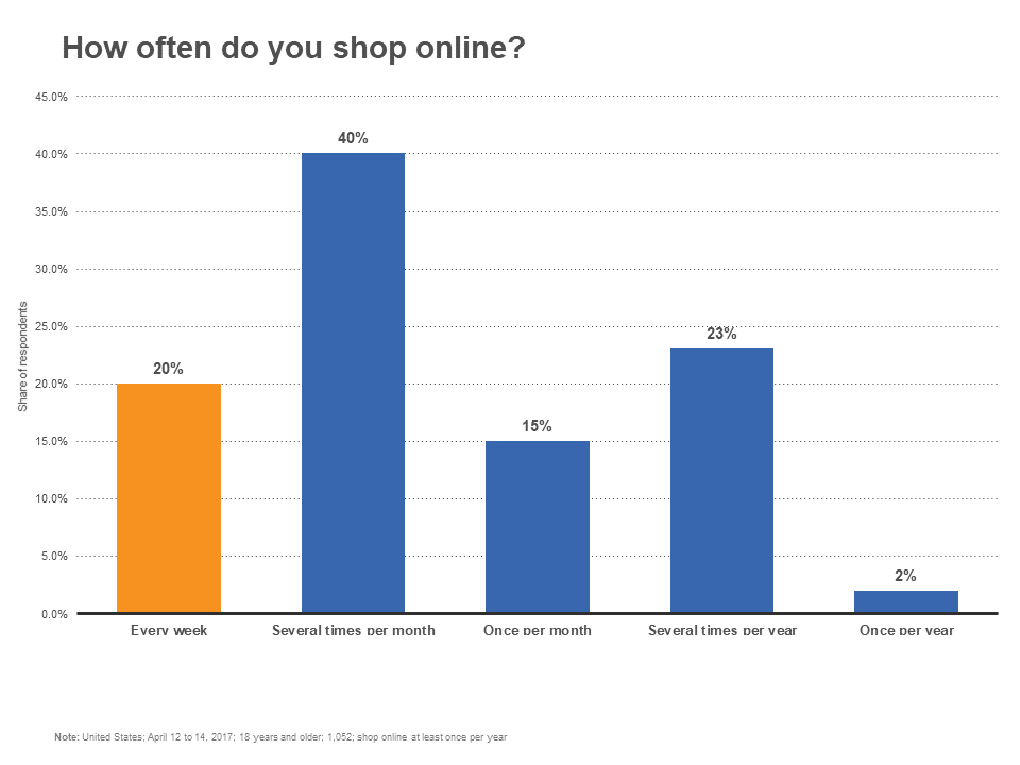
Americans are shopping online frequently and with consistently. Only 2 percent of American consumers said they shop only once per year online. One in five said they shop online every week and 40 percent —the clear plurality of respondents —said they shop online several times per month.
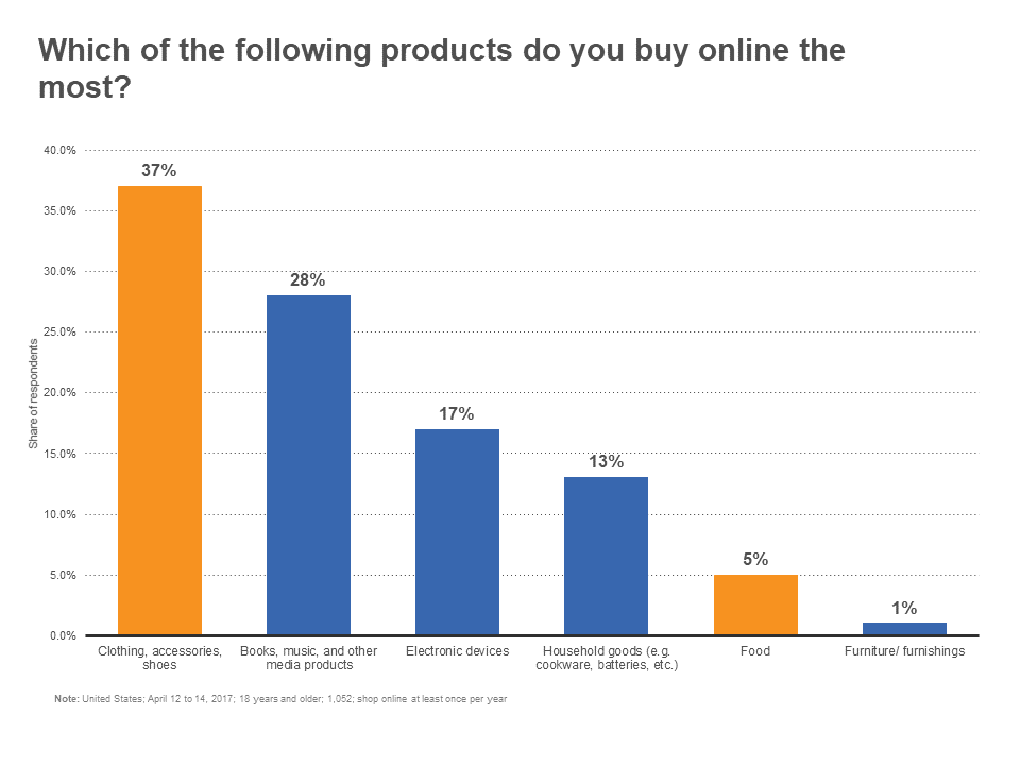
Clothing, accessories and shoes top the list for most often purchased online at 37 percent of respondents. Media and entertainment products follow for American consumers with 28 percent, followed by electronic devices at 17 percent. Online purchases of food sit at only 5 percent for American consumers — this is likely to grow in coming years as innovations like UberEats, GrubHub, Amazon Fresh and other online grocery and restaurant delivery services expand.
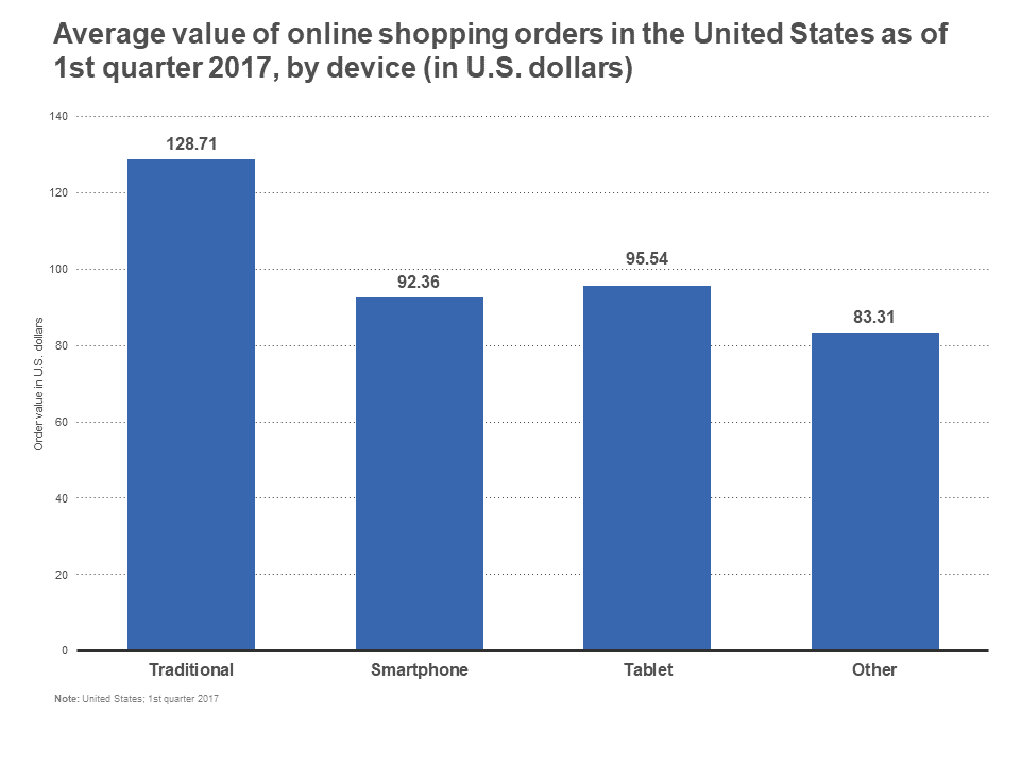
Even as mobile devices and payments products like mobile wallets continue to grow, orders from traditional online shopping devices — desktops and laptop personal computers — have the highest average value at $128.71. Tablets and smartphones are virtually identical in terms of average value of orders at $95.54 and $92.36 respectively.
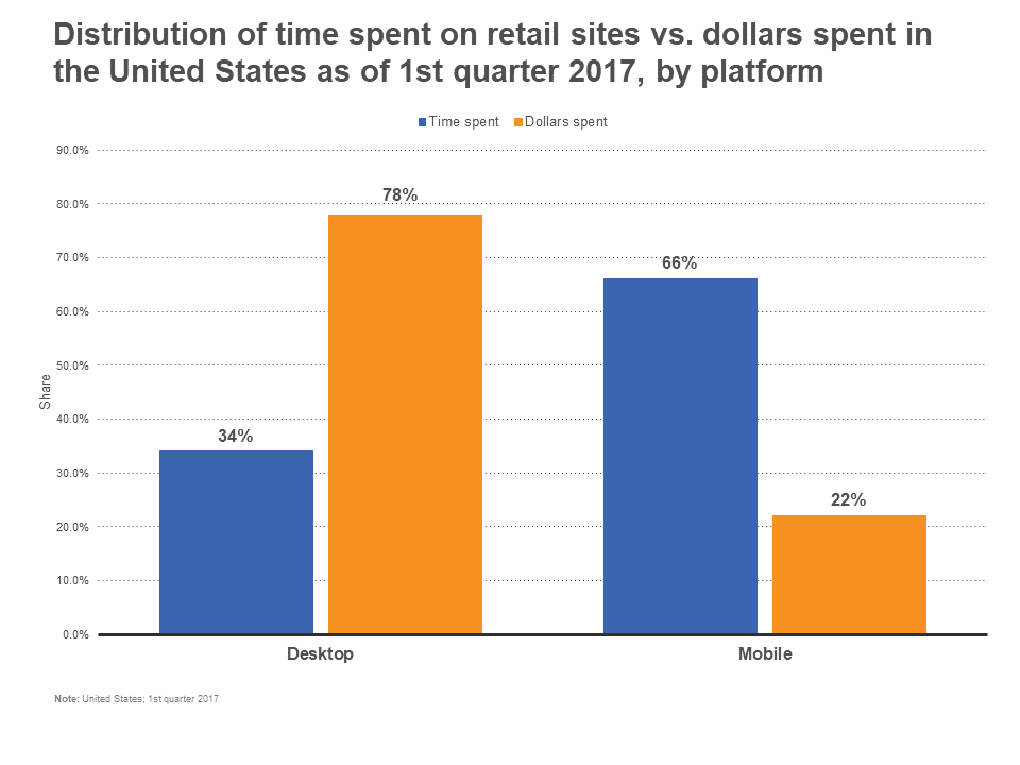
Furthermore, desktop purchases are much more efficient. In terms of time spent vs. dollars spent on a retail website, the comparative distributions between desktop and mobile users are inverse. In other words, mobile users spend more time and spend less money where desktop users spend more money and less time.
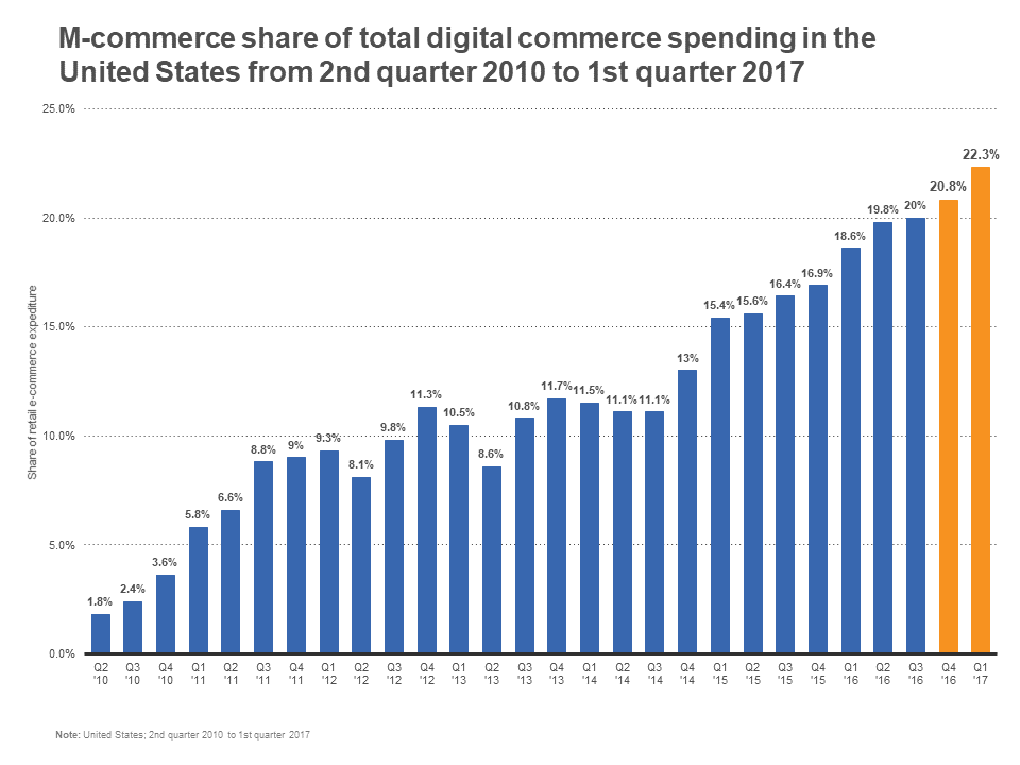
However, only a fool would count mobile out in terms of potential in e-commerce. In fact, mobile has grown at a staggering rate. Where mobile commerce enjoyed only 1.8 percent of the total U.S. digital commerce spending in Q2 of 2010, it has since rocketed to nearly a quarter of all mobile in Q1 of 2017. And its total share jumped 1.5 percent between Q4 of 2016 and Q1 of 2017.
And consumer spending in mobile applications has experienced a significant spike over mobile browser spending. In just a year, the average value of shopping purchases from a mobile application has increased $32 — from $98 in Q2 of 2015 to $127 in Q2 of 2016 — where mobile browser orders have fallen $7.
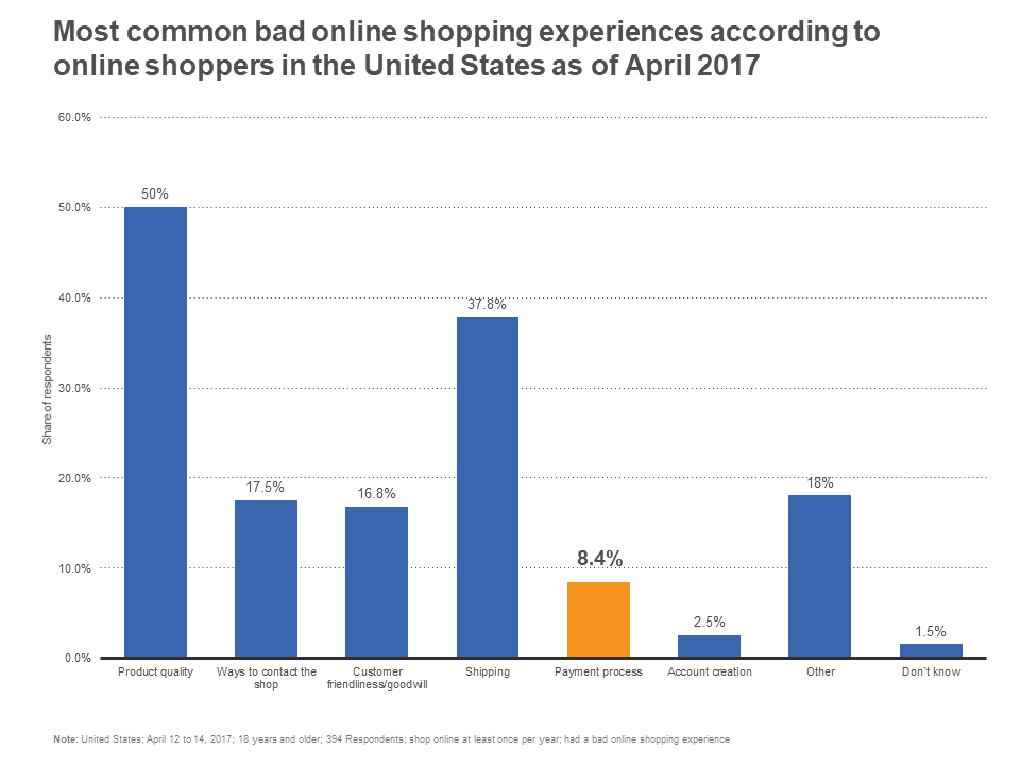
It is clear, then, that having payments streamlined into mobile applications and mobile-friendly website will continue to be important to merchants who hope to stay competitive in the online retail space. But the integration of convenient, secure and intuitive payments options is also an important key for merchants to secure orders. Ten percent of respondents said they would cancel an order due to lack of payment options; 8.4 percent said the payment process was the primary reason they had a bad experience while shopping online.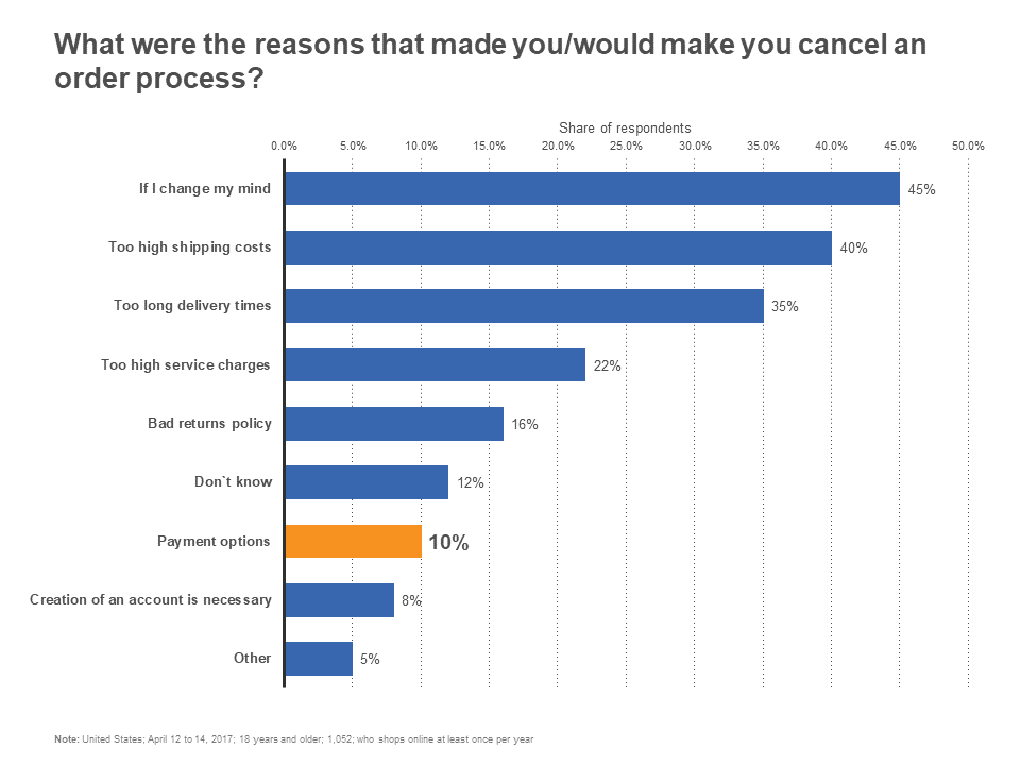
Methodological information on each graph available here: graph 1, graph 2, graph 3, graph 4, graph 5, graph 6, graph 7, graph 8.


